Public speaking course notes Read "Dynamo, Amazon’s Highly Available Key-value Store" Read "Bigtable, A Distributed Storage System for Structured Data" Read "Streaming Systems" 3, Watermarks Read "Streaming Systems" 1&2, Streaming 101 Read "F1, a distributed SQL database that scales" Read "Zanzibar, Google’s Consistent, Global Authorization System" Read "Spanner, Google's Globally-Distributed Database" Read "Designing Data-intensive applications" 12, The Future of Data Systems IOS development with Swift Read "Designing Data-intensive applications" 10&11, Batch and Stream Processing Read "Designing Data-intensive applications" 9, Consistency and Consensus Read "Designing Data-intensive applications" 8, Distributed System Troubles Read "Designing Data-intensive applications" 7, Transactions Read "Designing Data-intensive applications" 6, Partitioning Read "Designing Data-intensive applications" 5, Replication Read "Designing Data-intensive applications" 3&4, Storage, Retrieval, Encoding Read "Designing Data-intensive applications" 1&2, Foundation of Data Systems Three cases of binary search TAMU Operating System 2 Memory Management TAMU Operating System 1 Introduction Overview in cloud computing 2 TAMU Operating System 7 Virtualization TAMU Operating System 6 File System TAMU Operating System 5 I/O and Disk Management TAMU Operating System 4 Synchronization TAMU Operating System 3 Concurrency and Threading TAMU Computer Networks 5 Data Link Layer TAMU Computer Networks 4 Network Layer TAMU Computer Networks 3 Transport Layer TAMU Computer Networks 2 Application Layer TAMU Computer Networks 1 Introduction Overview in distributed systems and cloud computing 1 A well-optimized Union-Find implementation, in Java A heap implementation supporting deletion TAMU Advanced Algorithms 3, Maximum Bandwidth Path (Dijkstra, MST, Linear) TAMU Advanced Algorithms 2, B+ tree and Segment Intersection TAMU Advanced Algorithms 1, BST, 2-3 Tree and Heap TAMU AI, Searching problems Factorization Machine and Field-aware Factorization Machine for CTR prediction TAMU Neural Network 10 Information-Theoretic Models TAMU Neural Network 9 Principal Component Analysis TAMU Neural Network 8 Neurodynamics TAMU Neural Network 7 Self-Organizing Maps TAMU Neural Network 6 Deep Learning Overview TAMU Neural Network 5 Radial-Basis Function Networks TAMU Neural Network 4 Multi-Layer Perceptrons TAMU Neural Network 3 Single-Layer Perceptrons Princeton Algorithms P1W6 Hash Tables & Symbol Table Applications Stanford ML 11 Application Example Photo OCR Stanford ML 10 Large Scale Machine Learning Stanford ML 9 Anomaly Detection and Recommender Systems Stanford ML 8 Clustering & Principal Component Analysis Princeton Algorithms P1W5 Balanced Search Trees TAMU Neural Network 2 Learning Processes TAMU Neural Network 1 Introduction Stanford ML 7 Support Vector Machine Stanford ML 6 Evaluate Algorithms Princeton Algorithms P1W4 Priority Queues and Symbol Tables Stanford ML 5 Neural Networks Learning Princeton Algorithms P1W3 Mergesort and Quicksort Stanford ML 4 Neural Networks Basics Princeton Algorithms P1W2 Stack and Queue, Basic Sorts Stanford ML 3 Classification Problems Stanford ML 2 Multivariate Regression and Normal Equation Princeton Algorithms P1W1 Union and Find Stanford ML 1 Introduction and Parameter Learning

Stanford ML 6 Evaluate Algorithms

2017-01-15

evaluating a learning algorithm

deciding what to try next

debugging a learning algorithm

Unacceptably large errors in its predictions.

  1. get more training examples - fix high variance
  2. try smaller sets of features - fix high variance
  3. try getting addtional features - fix high bias
  4. try adding polynomial features - fix high bias
  5. try decreasing - fix high bias
  6. try increasing - fix high variance

diagnostic

A test that you can run to gain insight what is/isn’t working with a learning algorithm, and gain guidance as to how best to improve its performance.

Diagnostics can take time to implement, but doing so can be a very good use of time.

evaluating a hypothesis

training set: 70% (better randomly shuffled)
test set: 30%

training/testing procedure for linear regression

  1. learning parameter from training data (minimizing training error )
  2. compute test set error (cost function)
  3. get missclassification error (percentage of wrong predictions if classification problem)

model selection and training/validation/test sets

model selection

d: what degree of polynomial to choose for hypothesis

calculate the test set error for different degrees of polynomial cnd choose the one with minimum error

evaluating hypothesis

  1. training set: 60%
  2. cross validation set: 20%
  3. test set: 20%

Test parameters with different degree of polynomial on cross validation set. Estimate generalization error on the test set

bias vs. variance

diagnosing bias vs. variance

High bias: underfit. high training error and high validation error
High variance: overfit. low training error and much high validation error

regularization and bias/variance

regularization parameter

  • large : high bias (underfit)
  • small : high variance (overfit)

Define the cost function of training, validation and test sets without regularization terms.

  1. Create a list of
    (i.e. );
  2. Create a set of models with different degrees or any other variants.
  3. Iterate through the s and for each go through all the models to learn some .
  4. Learn the parameter for the model selected, using with the selected.
  5. Compute the train error using the learned (computed with ) on the without regularization or .
  6. Compute the cross validation error using the learned (computed with ) on the without regularization or .
  7. Select the best combo that produces the lowest error on the cross validation set.
  8. Using the best combo and , apply it on to see if it has a good generalization of the problem.

learning curve

Plot or vs training set size m.
While m increases:

  • increasing
  • decreasing

While bias is high:

  • The final errors for both training and validation will be high and similar
  • Getting more training data will not help much

While variance is high:

  • large gap between final errors for training and validation sets but approach each other while m increases
  • getting more training data is likely to help

neural network

  • small neural network: fewer parameters; more prone to underfitting; computationally cheaper
  • large neural network: use regularization to address overfitting

predictActual

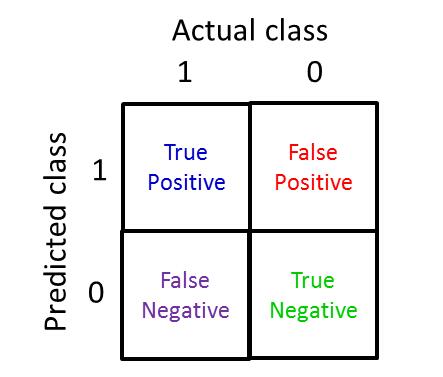
precision = (true positives)/(no. of predicted positive)
recall = (true positives)/(no. of actual positive)

use F1 score formula to evaluate algorithms:


Creative Commons License
Melon blog is created by melonskin. This work is licensed under a Creative Commons Attribution-NonCommercial 4.0 International License.
© 2016-2024. All rights reserved by melonskin. Powered by Jekyll.